August 2026 Portland Metro Real Estate Market Update: Sales Up, Showings Down

by Joe Saling

Downtown skyline at golden hour from the Eastbank Esplanade, Portland, Oregon

The downtown skyline from the Eastbank Esplanade, Multnomah County. July closed more sales than last summer while prices held flat.

Quick Answer

Portland Metro closed 2,167 homes in July 2026, up 8.1% from July 2025, while the median sale price held at $555,000, exactly where it sat a year ago. Inventory is 3.3 months. Buyers have more time and more negotiating room than last summer.

Here is the number that surprised me. Portland Metro closed 2,167 homes in July, an 8.1% jump over last July and the strongest July volume in three years. Meanwhile the median landed at $555,000, the identical figure it hit last July. More homes changed hands, and the price did not move.

Inventory finished at 3.3 months, down from 3.7 a year ago. Market time stretched to 54 days. Affordability improved: the payment on a median-priced home runs about $76 a month less than a year ago.

So why does the market feel slower than those closings suggest? Because closings tell you what happened in May and June. The forward-looking numbers point somewhere else, and you can track the current Portland Metro market data between reports.

$555K Median Sale Price (YoY 0.0%)
3.3 Inventory in Months (3.7 last July)
2,167 Closed Sales (YoY +8.1%)
54 days Total Market Time (52 last July)
2,133 Pending Sales (YoY -2.0%)

Market Overview: Strong Closings, Flat Prices
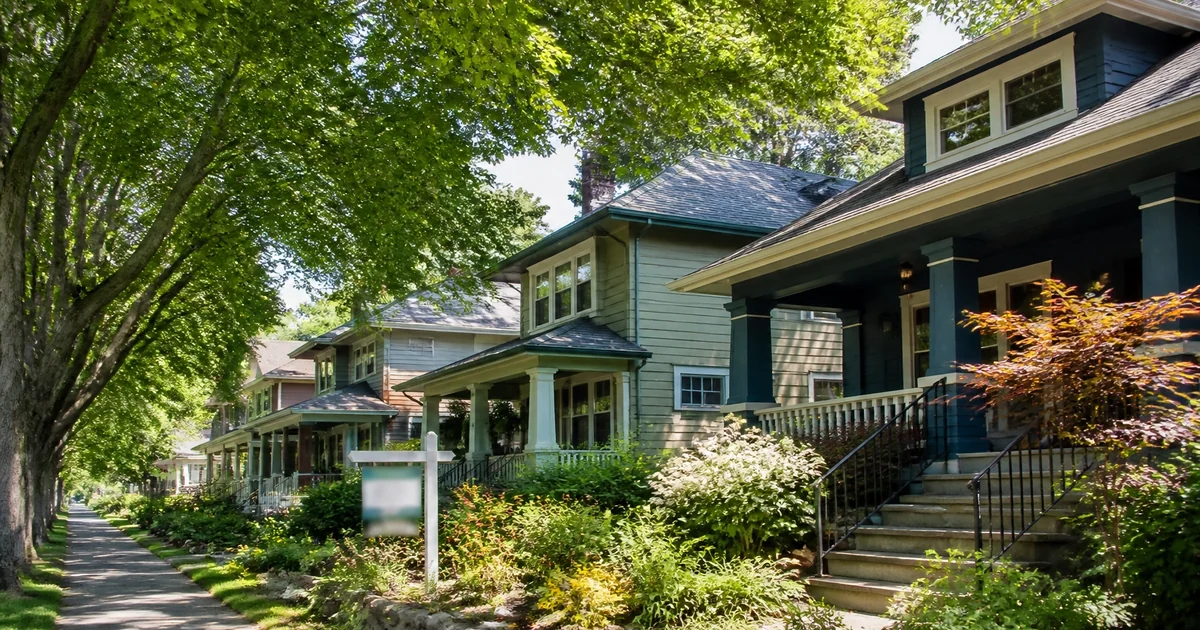
Tree-lined street of craftsman bungalows in NE Portland, Oregon
A residential street in NE Portland, where closings rose 5.4% in July even as pending sales fell 15.9%.

The gap between volume and price is the story. July delivered 2,167 closed sales against 2,005 a year ago, and year-to-date closings are up 5.0%. Yet the median matched July 2025 to the dollar. Volume is growing. Pricing power is not.

Inventory tells a similar story. At 3.3 months, supply is tighter than last July's 3.7 but has barely moved since spring: March through July ran 3.0, 3.1, 3.2, 3.1 and 3.3.

+ Continue reading: Full market analysis Pending sales fell 12.5% from June against a normal drop of 4.0%, and the average now runs $77,500 above the median.

The demand story. Pending sales came in at 2,133, down 2.0% from last July and 12.5% from June, where last year the same transition cost only 4.0%. Pendings are the deals being written right now, and year to date they are still up 4.4%. July cooled faster than the calendar explains.

The price story. The average reached $632,500, up 1.7%, while the median held flat. When the average climbs and the median does not, the upper end carries more volume: sales above $900,000 were 13.9% of closings against 12.3% last July. On a rolling 12-month basis the average is up 0.4%, the median down 0.7%.

How Portland compares. National existing-home sales ran at a 4.06 million annual rate in July, up 0.7%, with a median of $434,100, up 2.0%. Portland closes far more homes than the nation while pricing slower. Case-Shiller had Portland at -0.79% in May against 1.1% nationally.

Source Convergence: Buyer Leverage

Realtor.com research for July 2026 found 31.0% of Portland listings carried a price reduction, the highest of the 50 largest U.S. metros and well above the 20% national figure. Different data set, same conclusion.

Data Point: July Trend Summary
  • Inventory: holding at 3.0 to 3.3 months since March
  • Pending Sales: down 2.0% year over year, up 4.4% year to date
  • Median Price: up 8.8% since January, down 1.8% since June
  • Market Time: 91 days in February to 54 in July, still 2 above last July

Buyer Activity: What the Lockboxes Say

Every lockbox opened to show a home gets counted, which makes SentriLock activity the earliest read on buyer demand, surfacing in pending sales two to four weeks later. July recorded 65,093 opens, down 6.0% from last July and 5.4% from June.

Set that against closings up 8.1% and you have this month's tension. Buyers finished a lot of transactions. They started fewer. Showings ran ahead of 2025 from January through May, went negative in June, and widened to a 6.0% deficit in July. A turn, not a blip.

+ See the full showing data breakdown Not one week in July matched its 2025 counterpart, and each new listing drew about 21.7 showings.

Week by week. In rolling seven-day windows, July ran 13,216 opens through July 10, then 15,691, 14,949 and 15,161. Against the same weeks in 2025 those came in 12.0%, 7.7%, 7.6% and 3.6% lower. A consistent shortfall, not one slow stretch.

Historical context. July 2026 landed above 2024 (64,196) and 2022 (64,166), just under 2023 (66,163), and 1.3% below the four-year July average. Not a collapse, a return to the middle of the range.

What it signals for fall. Each new listing drew about 21.7 showings, so buyers are looking at plenty before writing. With pendings down 12.5%, expect softer August and September closings.

Want to See What Is Actually Available?

Numbers describe the market. Homes are what you buy. Browse what is available now, or reach out and we will talk it through.

Affordability: The Quiet Improvement

Two buyers walking up to a mid-century ranch home, Beaverton, Oregon
Buyers touring a home in Beaverton, Washington County, where pending sales climbed 22.9% year over year in July.

The math on a median-priced home: $555,000 with 20% down finances $444,000. At July's average 6.54% from the Freddie Mac Primary Mortgage Market Survey, that is roughly $2,818 a month in principal and interest. Taxes, insurance and maintenance are extra.

The same $555,000 at last July's 6.80% produced about $2,895. Buyers today pay roughly $76 less per month for the identical home. That is the whole improvement in one sentence: prices stopped rising and rates eased.

+ Read more: How affordability is trending The affordability index reads 95%, up 8 points from a year ago, and 6,808 listings are ready for immediate occupancy.

The income side. At a 28% front-end ratio counting principal and interest only, that payment takes roughly $120,800 a year. HUD puts metro median family income at $128,300, so a median-income family can reach a median-priced home. Not reliably true since 2021.

The index. The RMLS affordability index measures what share of that payment a median-income family covers. It reads 95%, up from 87% a year ago, and that came from flat prices and softer rates rather than rising incomes.

What you can buy, and at what rate. Of 7,253 active listings, 6,808 are ready for purchase and occupancy now, a 3.1-month supply. Freddie Mac reported 6.67% on August 13, about $2,856 on the same loan.

What This Means for Buyers

You have leverage you did not have in the spring. Nearly a third of listings carry a price reduction, homes take 54 days to go under contract, and lighter showing traffic means fewer competing buyers. None of that means prices are about to fall. It means the seller across the table has been waiting a while, and that changes the conversation.

Win Strategy: Current Buyer Conditions

This market rewards a specific buyer. If these describe you, the next few months deserve attention.

  • You plan to stay five to seven years, so a flat year or two will not hurt.
  • You are targeting homes listed 30 days or longer, where expectations have adjusted.
  • You ask about closing cost credits or a rate buydown, not just price. That often costs the seller less.
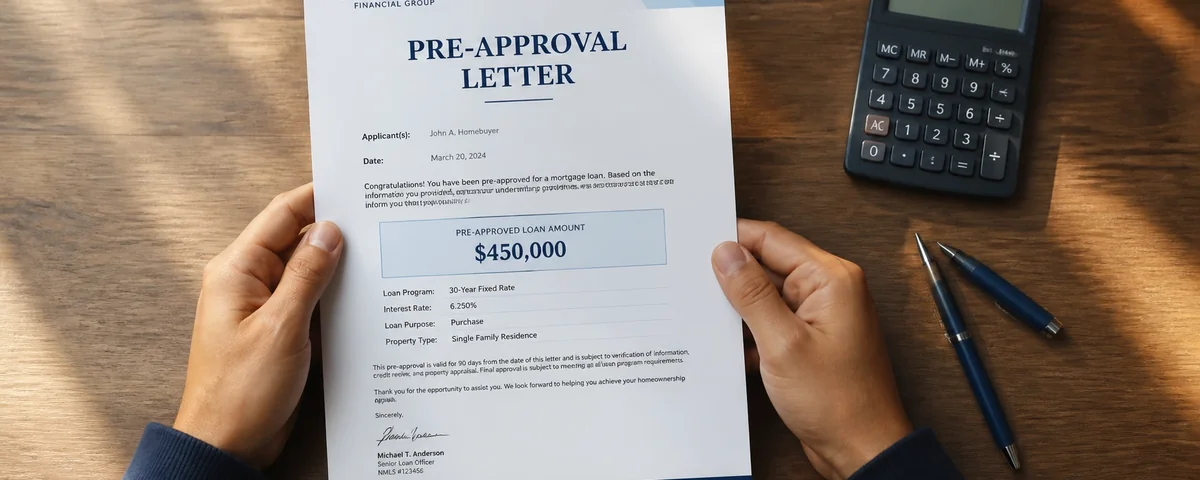
  • You have a real pre-approval, because a clean offer beats a higher shaky one.
+ When this advice doesn't apply With the median flat and Case-Shiller at -0.79%, a two-year hold may not cover your transaction costs.
Important: When This Advice Does Not Apply

Buying now is wrong for some people, and I would rather say so plainly. If you expect to move again within two or three years, think hard. The median has not risen in twelve months and Case-Shiller has Portland slightly negative. Transaction costs can exceed what a flat market gives back.

If the payment only works by stretching your debt-to-income ratio, or by assuming a refinance, wait. Refinancing is a possibility, not a plan. And if you are buying to flip, flat prices and 54-day market times work against a quick turn.

What This Means for Sellers

Homes are still selling, and more sold in July than last July. The catch is that the market is paying last year's prices, and pendings dropped 12.5% from June against a normal 4.0%. Three things matter most from here.

Price to the market you are in, not the one you remember. Nearly a third of listings have taken a price cut, which usually means they launched too high, and your first two weeks generate the most traffic you will ever get. Invest in presentation. At 54 days of market time, buyers are comparing carefully. Be flexible on terms. A closing cost credit often moves a hesitant buyer for less than a price cut, and it keeps your sale price intact for the comps.

+ When this advice doesn't apply Hillsboro and Forest Grove pendings fell 24.0% while Beaverton and Aloha rose 22.9%, so the right move depends on where you sit.
Important: When This Advice Does Not Apply

Listing this month is not automatically right, and the metro average hides a lot. Pendings in Hillsboro and Forest Grove fell 24.0% while Beaverton and Aloha rose 22.9%. Those areas call for different pricing and timing.

If you do not have to move and your home needs work you cannot fund, waiting through winter to prepare can beat listing unprepared. And if your plan depends on hitting a specific number to make the next purchase work, run that math before the sign goes up.

Sub-Market Spotlight

View west across the Tualatin Valley toward the Coast Range, Washington County, Oregon
Looking west across the Tualatin Valley in Washington County, home to three of the metro's fifteen RMLS sub-markets.

The metro number averages fifteen different places. Medians below are year-to-date Area Report figures, the only median RMLS publishes by area. Closed sales are July counts.

Area Median Price (YTD) YoY Price Closed Sales (Jul) YoY Sales
Beaverton / Aloha $544,800 -1.8% 175 +10.8%
NE Portland $525,000 0.0% 196 +5.4%
SE Portland $470,000 -0.9% 251 0.0%
Lake Oswego / West Linn $900,000 +5.2% 119 -1.7%
Hillsboro / Forest Grove $509,000 -3.0% 146 +16.8%
Swipe to see more columns
+ View all 15 Portland Metro sub-markets Oregon City and Canby closed 28.2% more homes than last July, and NW Washington County jumped 34.1%.
Area Median Price (YTD) YoY Price Closed Sales (Jul) YoY Sales
W Portland $670,000 +1.5% 235 +13.0%
Tigard / Wilsonville $609,900 -1.6% 209 -7.5%
Milwaukie / Clackamas $560,000 -1.8% 189 +13.2%
Gresham / Troutdale $490,000 +2.1% 142 +1.4%
Oregon City / Canby $590,000 +0.2% 132 +28.2%
NW Washington Co. $700,000 -3.4% 110 +34.1%
Yamhill Co. $484,500 -0.1% 100 +9.9%
N Portland $485,000 +1.0% 88 -6.4%
Columbia Co. $464,900 +1.1% 60 +42.9%
Mt. Hood $520,000 +8.9% 15 +36.4%
Swipe to see more columns

Read the small areas carefully. Mt. Hood's 36.4% jump came from 15 sales against 11, so a few sales swing it. The high-volume areas tell you more: SE Portland at 251 closings, W Portland at 235, Tigard and Wilsonville at 209. You can explore the Portland area communities if one of these is on your list.

Inventory in Months, 2026

Inventory in months answers one question: at the current pace, how long to sell everything listed? Under 3 favors sellers, over 6 favors buyers. Portland sits in between.

Month 2026
January 4.3
February 3.6
March 3.0
April 3.1
May 3.2
June 3.1
July 3.3
Swipe to see more columns
+ View the 3-year inventory comparison July inventory went from 2.8 months in 2024 to 3.7 in 2025 and back to 3.3 this year.
Month 2024 2025 2026
January 3.2 3.7 4.3
February 2.8 3.2 3.6
March 2.3 3.0 3.0
April 2.4 3.1 3.1
May 2.3 3.3 3.2
June 2.6 3.6 3.1
July 2.8 3.7 3.3
August 3.0 3.5 -
September 3.5 3.8 -
October 2.9 3.1 -
November 3.0 3.8 -
December 2.7 2.9 -
Swipe to see more columns
+ See where the sales actually happened by price The $400,000 to $700,000 band took 52.7% of July closings, and sales above $900,000 grew to 13.9% from 12.3%.

Counts come from the RMLS price-range table, which RMLS restates as late sales report in, so prior-year totals run above the published headline figures.

Price Range Jul 2025 Sales Jul 2025 Share Jul 2026 Sales Jul 2026 Share
Under $300K 156 7.5% 187 8.6%
$300K to $400K 242 11.6% 231 10.7%
$400K to $500K 387 18.6% 417 19.2%
$500K to $600K 419 20.1% 399 18.4%
$600K to $700K 287 13.8% 326 15.0%
$700K to $900K 333 16.0% 306 14.1%
$900K to $1M 75 3.6% 95 4.4%
$1M and above 181 8.7% 206 9.5%
Swipe to see more columns

The $400,000 to $700,000 band took 52.7% of July closings. Price inside that range and you compete in the busiest part of this metro.

What Is Your Home Worth in This Market?

Metro averages will not tell you what your home will sell for. Your area, price band, and condition all move the number.

Looking Ahead

Three things will shape this market through year end.

1. Where mortgage rates settle. The Federal Reserve held at 3.50% to 3.75% on July 29, with three officials dissenting in favor of a hike. A committee arguing about raising rates will not deliver the cuts that push mortgages below 6.5%. Plan around the mid-6s.

2. The fall pending-sales pattern. July pendings fell 12.5% from June against 4.0% last year. If August and September run below 2025, closings follow with a one to two month lag.

3. Oregon employment. Unemployment held at 5.2% in June against 4.2% nationally, and the state shed 8,500 jobs this past year, per the Oregon Employment Department. Housing demand follows payrolls with a lag.

+ See all factors to watch A new Oregon law gives families a 90-day head start before private equity firms can buy single-family homes.

4. Oregon's 2026 housing laws. Of six bills signed in April, the one buyers should know is House Bill 4128, giving families and small businesses a 90-day head start before private equity firms can buy single-family homes. Supply effects arrive over years.

5. Construction costs. The National Association of Home Builders estimates tariffs add about $10,900 to a typical new home, plus $131,734 in regulatory costs. New construction will not arrive cheap or fast.

6. The regional economy. The Portland Metro Chamber reported 8,800 jobs lost in 2025 and a multifamily pipeline of 656 units, lowest since 2011. Meanwhile Kidder Mathews reports office vacancy holding at 15.3% with positive absorption, the first improvement since 2020.

7. The national comparison. If national price growth holds near 2% while Portland stays flat, this metro gets more affordable against its peers, which historically pulls relocation buyers.

8. The August RMLS report. It shows whether July's showing decline became an August pending decline. Near 2,100 pendings means seasonal. Below 2,000 means the fall market is genuinely softer. See earlier Portland Metro market updates for how past calls played out.

Frequently Asked Questions

 
Is August 2026 a good time to buy a home in Portland? +
For buyers planning to stay five years or more, conditions are favorable. Homes take 54 days to sell, 31% of listings have a price reduction, and the monthly payment on a median home runs about $76 less than last year. Short-term buyers face more risk with prices flat.
How much have Portland home prices changed in 2026? +
The July 2026 median sale price was $555,000, unchanged from July 2025. Year to date the median is $549,900 against $550,000 last year, essentially flat. The average sale price rose 1.7% to $632,500, reflecting more activity at the upper end rather than broad price growth.
What does 3.3 months of inventory mean for Portland buyers? +
It means every listed home would sell in 3.3 months at July's pace. Under 3 months favors sellers, over 6 favors buyers, so Portland sits in balanced territory. That is down from 3.7 months last July but up from 2.8 in July 2024.
Which Portland sub-market is strongest right now? +
Beaverton and Aloha led the metro in July with pending sales up 22.9% year over year and closings up 10.8%, at 45 days of market time. Tigard and Wilsonville followed with pendings up 11.2% and the metro's second-tightest inventory at 2.7 months.
Why are Hillsboro and Forest Grove home sales slowing? +
Pending sales there fell 24.0% year over year in July, the steepest decline of the fifteen sub-markets, and the year-to-date median dropped 3.0% to $509,000. July closings still rose 16.8%, which reflects earlier contracts. The pending number is the forward signal to watch.
What is the monthly payment on a median-priced Portland home? +
On the $555,000 median with 20% down at July's 6.54% average rate, principal and interest run about $2,818 monthly. Property taxes, insurance and maintenance are additional. At the August 13 rate of 6.67%, the same loan costs roughly $2,856 per month.
Will Portland home prices drop in late 2026? +
No one can predict prices, but the signals point to flat rather than falling. The median has held steady for twelve months, inventory sits in a balanced 3.0 to 3.3 month range, and showings are down 6.0%. Softening demand with steady supply usually produces stagnation, not decline.
Why did closed sales rise while showings fell in July? +
Closings reflect contracts written 30 to 60 days earlier, so July's 8.1% gain came from strong May and June activity. Lockbox showings and pending sales measure demand happening now, and both declined. The forward indicators matter more than the closing count.

Let's Talk Through Your Situation

Buying, selling, or working out whether this year makes sense, I am happy to walk through the numbers. When you are ready, I am here.

Homes for Sale in Portland

Data Sources and References (as of August 2026)

Market statistics: RMLS Market Action Report, July 2026 reporting period; sub-market medians are year-to-date. Showings: SentriLock daily counts via RMLS.

Rates: Freddie Mac PMMS. Fed: July 2026 FOMC statement. Income: HUD income limits.

National: NAR existing-home sales for July 2026, S&P Cotality Case-Shiller. Employment: Oregon Employment Department. Construction: NAHB. Price cuts: Realtor.com, corroboration only.

Data verified: August 2026

Joe Saling

Real Estate Advisor | Saling Homes at eXp Realty

Joe Saling has been helping Portland-area buyers and sellers for 10 years, backed by 20+ years in sales, marketing, and leadership. He specializes in the Portland Metro market with a focus on data-driven decisions and client education. His approach: educate first, advocate always.

(503) 910-7364 | joe@sellingpdxhomes.com | sellingpdxhomes.com | About Joe

Saling Homes at eXp Realty is committed to equal housing opportunity. We do not discriminate on the basis of race, color, religion, sex, handicap, familial status, or national origin.

GET MORE INFORMATION

Joe Saling

Joe Saling

+1(503) 910-7364

Agent | License ID: 201213671

Agent License ID: 201213671

Name

Name

Phone*

Phone

Message