November 2026 Portland Metro Housing Market Update: Sellers Pull Back

The St. Johns Bridge above Cathedral Park in North Portland as late-October fog lifts. Sales slowed this fall, but prices held steady.
In October 2026, Portland Metro buyers and sellers both stepped back. Pending sales fell 20.2% from a year earlier to 1,587, and new listings fell to 2,077, the fewest for any October since at least 1992. Because supply and demand dropped together, inventory held at 4.3 months and the median price stayed at $545,000, up 0.9%.
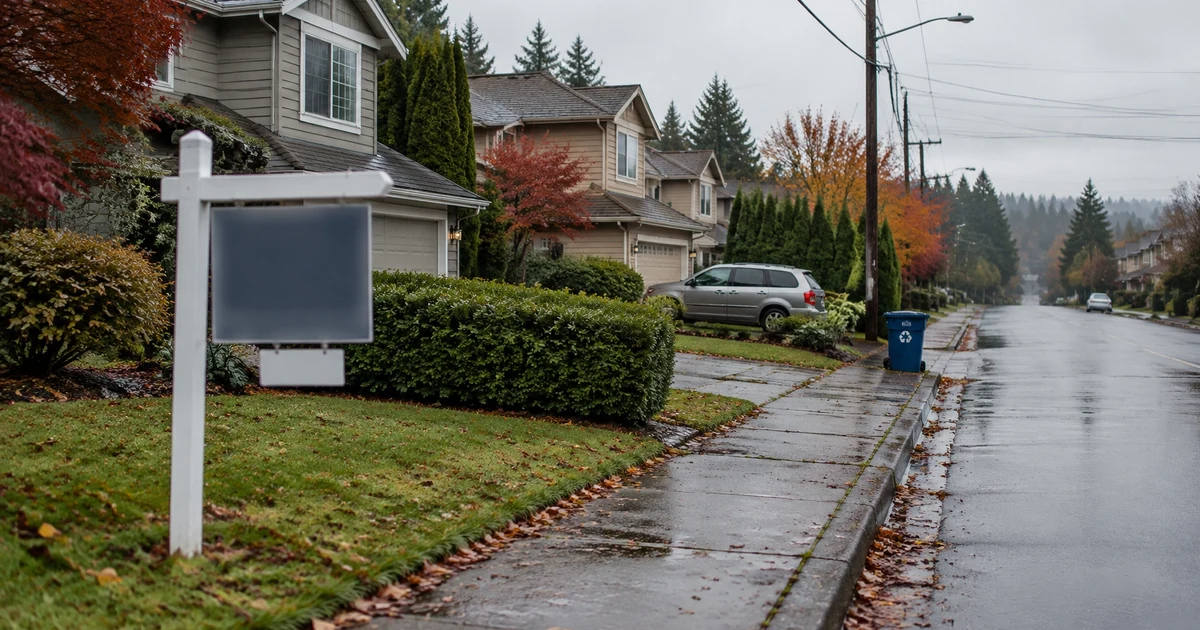
If you live in Tigard, Beaverton, or Hillsboro, you may have noticed it on your own street: fewer For Sale signs going up this fall. October was the month both buyers and sellers hit pause, and the westside paused more than anywhere else in the metro. Mortgage rates averaged 7.33%, the highest of 2026, and an election was days away.
The October RMLS Market Action Report shows closed sales down 21.5% to 1,622 and pending sales down 20.2% to 1,587. But new listings also fell 12.2% to 2,077, the fewest for any October since at least 1992. So inventory barely moved: 4.3 months, meaning it would take about that long to sell every home on the market at today's pace. That is up from 4.2 in September and 3.1 a year ago. The median sale price held at $545,000, up 0.9% from last October, and total market time was 67 days, two days shorter than a year ago.
So the market got smaller, not cheaper. What does that mean if you are planning a move this winter?
- Record-low October listings kept inventory at 4.3 months and the median at $545,000
- Showings hit an October record low, down 21.2%, with the widest gap the week before Election Day
- The median home now costs $2,998 a month in principal and interest, $338 more than a year ago
- Buyers face the lightest competition in years; sellers face fewer competing listings
- The westside slowed most: Washington County pendings fell 33.0% vs 14.3% elsewhere
- After the election, rates fell a third straight week to 7.18%, and housing policy looks steady
- November is the test: will buyers return before the holidays?
Market Overview: Buyers and Sellers Both Stepped Back
For three months, buyers pulled back while sellers kept listing. In October, sellers pulled back too. New listings fell 16.5% from September, more than three times last year's drop of 5.3%. Active listings fell 5.2% to 7,027, a normal seasonal dip, and remain 8.0% above last October.
Because supply fell with demand, inventory rose just 0.1 month to 4.3, the highest October since 2011 but still balanced territory, not a glut. Track it anytime on our current Portland Metro market data page.
Realtor.com's October 2026 housing report shows Portland-area active listings up 9.6% and new listings down 11.8%, close to RMLS's 8.0% and 12.2%. Its 30.6% price-cut share is slightly below last year, which fits a flat median.
- Inventory: up from 3.2 to 4.3 months, May through October
- Pending Sales: from +7.5% YoY in June to -20.2% in October
- New Listings: -12.2% YoY in October after four months within 3% of last year
- Median Price: down 3.5% since the June peak of $564,900, up 0.9% YoY
Buyer Activity: Showings Hit an October Record Low
Lockbox data is my earliest signal of buyer interest, and October set a new low: 49,891 showings, down 21.2% from last year and the fewest of any October in records back to 2014.
One bright spot: because new listings fell even faster, each new listing drew more showings, 24.0 versus 22.4 in September.
Want to See What's Out There?
With fewer buyers touring, the homes on the market right now are getting less competition. Browse what is available, or tell me what you are looking for and what feels comfortable at today's rates.

Affordability: $338 More a Month Than Last Fall
The math on October's median home: $545,000 with 20% down, a $436,000 loan at 7.33%, October's average in the Freddie Mac Primary Mortgage Market Survey. Principal and interest comes to $2,998 a month. Property taxes, insurance, and maintenance are extra.
- October 2026: $2,998 on $545,000 at 7.33%
- October 2025: $2,660 on $540,000 at 6.25%
- November 5, 2026: $2,954 on $545,000 at 7.18%
That is $338 more per month than a year ago. About $313 of it comes from the higher rate; the $5,000 price difference adds about $25. At the November 5 rate, the payment is already $44 lower.
What This Means for Buyers
If you are buying, October handed you something rare: less competition, with homes selling about 1% below list on average. The tradeoff is roughly $300 a month more than last fall.
- Shop your rate. Freddie Mac notes multiple quotes can save thousands over a loan's life, and rates have already eased to 7.18%.
- Ask for seller credits. A credit toward a rate buydown can lower your payment more than the same dollars off the price.
- Look at new construction. The NAHB October builder confidence release found 43% of builders cut prices.
- Plan to stay five years or longer.
What This Means for Sellers
If you are selling, the good news is that you have less company. New listings hit a record October low, and well-priced homes still sell at a normal pace: 58 days in Beaverton/Aloha, down from 79 a year ago, and 67 in Tigard/Wilsonville, down from 84.
- Price to the market from day one. About three in ten Portland-area listings have taken a price cut.
- Invest in winter presentation: bright lighting, clean walkways, and daylight photos.
- Be flexible on terms. A credit toward a buyer's rate buydown can draw more buyers than a price cut alone.
- Start with a current number. Find out what your home is worth today before you set a list price.
And if you are sitting on a 3% mortgage, the real question is not what your home will sell for. It is what your next payment would be. That is a number I can run for you in ten minutes.
This may be one of your better windows in a while. Fewer homes are coming on the market, so yours will face less competition. If you plan to buy with substantial equity or cash, today's rates matter less to you than to most buyers. The catch: single-level homes are often in short supply, so the order you buy and sell in matters. That is a conversation worth having before spring.

Sub-Market Spotlight: The Westside Slowed Most
The westside slowed most: Washington County pending sales fell 33.0%, versus 14.3% for the rest of the metro. Tigard/Wilsonville fell 40.1%, partly a tough comparison after last October's 19.9% gain. Five key areas are below, and you can explore Portland area communities for more on each.
| Area | Median Price (YTD) | YoY Price (YTD) | Closed Sales | YoY Sales | Pending YoY | Inventory |
|---|---|---|---|---|---|---|
| Tigard/Wilsonville | $610,000 | -1.3% | 132 | -27.9% | -40.1% | 4.4 mo |
| Beaverton/Aloha | $535,000 | -2.7% | 127 | -19.6% | -31.2% | 4.4 mo |
| Hillsboro/Forest Grove | $510,500 | -2.1% | 130 | -26.1% | -25.6% | 3.7 mo |
| SE Portland | $470,900 | +0.2% | 220 | -11.6% | -12.3% | 2.8 mo |
| Lake Oswego/West Linn | $899,000 | +5.8% | 75 | -15.7% | +5.5% | 5.7 mo |
Inventory in Months: 2026 So Far
| Month | 2026 Inventory (Months) |
|---|---|
| January | 4.3 |
| February | 3.6 |
| March | 3.0 |
| April | 3.1 |
| May | 3.2 |
| June | 3.1 |
| July | 3.3 |
| August | 3.8 |
| September | 4.2 |
| October | 4.3 |
| November | Not yet reported |
| December | Not yet reported |
Every Move Starts With a Conversation
Tell me where you are and where you would like to be, and I will walk you through what this market means for you. No pressure, no script.
What the Election Means for Portland Housing
Every election season I hear the same question: should we wait until it's over? This year, a lot of buyers did. The final week before Election Day was October's weakest for showings, 26% below last year.
Here is what changed, based on OPB's 2026 election results and AP race calls:
- Washington, D.C.: The AP called both chambers of Congress for Democrats, so from January, Congress and the White House will be held by different parties.
- Salem: The AP called the governor's race for Gov. Tina Kotek, and the Legislature looks roughly unchanged, so expect steady state housing policy.
- Your property taxes: Voters approved school bonds in Hillsboro, North Clackamas, Reynolds, and Gladstone, per OPB's report on school measures. Most keep existing tax rates flat or lower. Results are unofficial until certified.
The part that touches your payment happened in the bond market: rates fell a third straight week to 7.18% on November 5, and lenders reported more activity after the results, per Scotsman Guide's post-election rate coverage.
Looking Ahead: What to Watch This Winter
Mortgage rates and the Fed. The Fed held rates on October 28, but two members voted for an increase, per the October 2026 FOMC statement. The next meeting is December 8 to 9, and the rate path depends mostly on inflation and energy prices.
November closings. October's 1,587 pendings become November's closings, which will likely land below last November's 1,520.
Will buyers come back? If lower rates bring buyers back, they will compete for record-low new supply, and the market could firm up quickly.
Frequently Asked Questions
Is November 2026 a good time to buy a home in Portland? +
How much have Portland home prices changed? +
What does 4.3 months of inventory mean? +
Why did pending sales drop so much in Tigard and Wilsonville? +
Is Beaverton or Hillsboro a buyer's market right now? +
How much is the monthly payment on a median-priced Portland home? +
How will the 2026 election affect Portland mortgage rates and home prices? +
Will Portland home prices drop in 2027? +
What Would This Market Mean for Your Move?
Whether you are buying, selling, downsizing, or just wondering, I would love to hear what you are planning. Every situation is different, and the right answer starts with listening. No pressure, no obligation.
Homes for Sale in Portland
Browse current listings in Portland.
Market statistics: RMLS Market Action Report, Portland Metro, October 2026 reporting period.
Showing activity: SentriLock lockbox data via RMLS, compiled in the Saling Homes Portland Market Intelligence Tracker. Historical October comparisons from the same tracker, 1992 to 2026.
Mortgage rates: Freddie Mac Primary Mortgage Market Survey, weekly readings October 1 through November 5, 2026.
Federal Reserve: FOMC statement, October 28, 2026.
Income: HUD income limits, 2026 median family income.
National context: NAR existing-home sales, September 2026; S&P Cotality Case-Shiller, August 2026; NAHB/Wells Fargo HMI, October 2026.
Employment: KLCC, Oregon September 2026 jobs report.
Election: OPB 2026 election results; OPB, Oregon school measures; Scotsman Guide, post-midterm mortgage rates. Election results are unofficial until certified by county election offices.
Corroboration: Realtor.com October 2026 Housing Report.
Payment estimates are principal and interest only, 20% down, 30-year fixed, and exclude taxes, insurance, and HOA dues.
Data verified: November 2026
Joe Saling
Real Estate Advisor | Saling Homes at eXp Realty
Joe Saling has been helping Portland-area buyers and sellers for 10 years, backed by 20+ years in sales, marketing, and leadership. He specializes in the Portland Metro market with a focus on data-driven decisions and client education. His approach: educate first, advocate always.
(503) 910-7364 | joe@sellingpdxhomes.com | sellingpdxhomes.com | About Joe
Saling Homes at eXp Realty is committed to equal housing opportunity. We do not discriminate on the basis of race, color, religion, sex, handicap, familial status, or national origin.
Categories
- All Blogs (94)
- Buying a Home (36)
- Community Page (14)
- Downsizing (7)
- Home Buying Process (7)
- Homeownership (6)
- Increasing Your Homes Value (4)
- Local Events (2)
- Market Update (22)
- Mortgage Information (9)
- Neighborhood Eats and Experiences (1)
- neighborhood info (3)
- Real Estate News (15)
- Selling Your Home (21)
Recent Posts









GET MORE INFORMATION