May 2026 Portland Metro Real Estate Market Update: Buyers Return
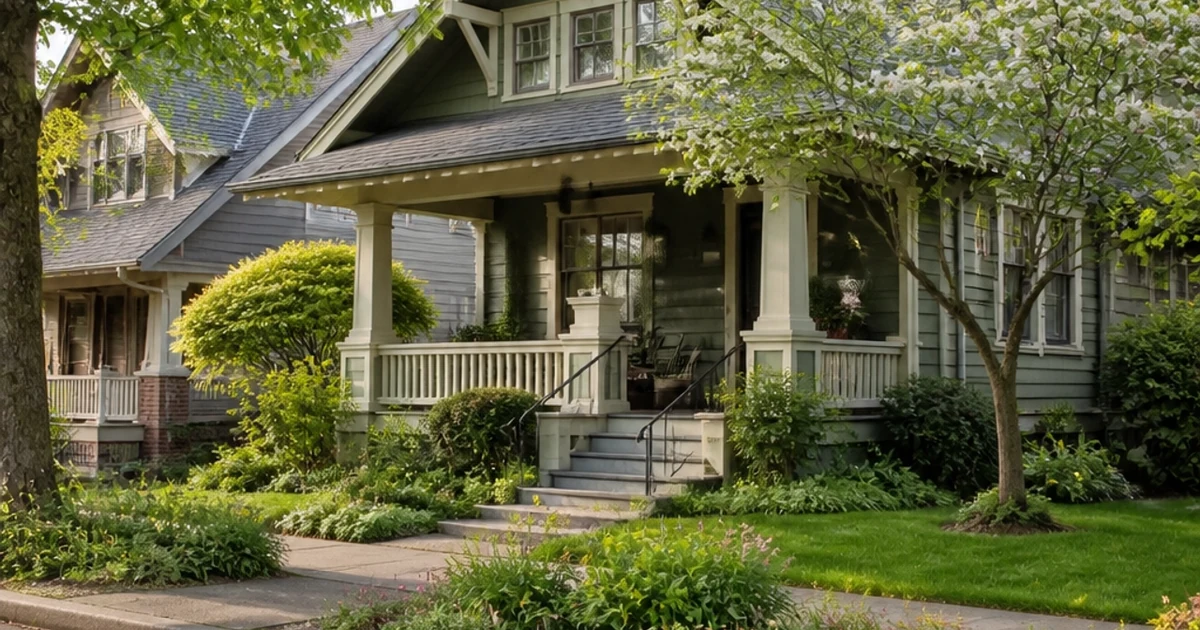
A Northeast Portland street on a clear spring morning. Buyer traffic across the metro reached its highest April level since 2018.
In April 2026, the Portland Metro median sale price held steady at $550,000, unchanged from a year ago and up 1.1% from March. Closed sales rose 7.1% year over year and buyer showings jumped about 21%, signs of a market that is steadily regaining its footing as mortgage rates ease.
April gave us one of the more encouraging readings in a while. The median sale price came in at $550,000, exactly where it sat in April 2025 and up 1.1% from March. Closed sales reached 2,013, up 7.1% over last April, and homes sold in 63 days, sixteen days faster than the month before. Inventory held at 3.1 months, flat with a year ago, keeping most neighborhoods leaning toward sellers.
Here is the honest picture. Prices are softening gently nationwide and Portland is part of that, so this is not a market racing upward. But local demand is clearly building, financing is more affordable than it was a year ago, and well-prepared homes are moving. For anyone who needs to buy or sell this year, those are conditions you can work with.
- The median price held flat year over year at $550,000 and rose 1.1% from March, a sign of stabilizing prices
- Buyer showings jumped about 21% over last April to roughly 84,000, the busiest April since 2018
- The monthly payment on a median home is about $160 lower than a year ago as rates eased to 6.33%
- Buyers have more choice and more time than during the frenzy years, with inventory holding near 3.1 months
- Well-priced, well-presented homes are still selling quickly, with market time down to 63 days
- Western suburbs led sales growth, with Beaverton, Aloha, and NW Washington County all up more than 24%
- Mortgage rates, Oregon housing legislation, and construction costs are the main factors to watch ahead

How We Got Here: A Market Finding Its Footing
The headline for April is stability. The metro median sale price was $550,000, identical to April 2025 and up 1.1% from March. Over a full rolling twelve months, the average sale price has moved just -0.4% and the median -0.2%. After several years of sharp swings, prices that barely budge over a year are a sign of a market settling into a steadier rhythm rather than one in decline.
Underneath that steady price line, activity picked up. New listings rose 24% from March, closed sales were up 7.1% year over year, and pending sales rose 5.9%. Inventory of 3.1 months is still tighter than a balanced six-month market, which is why most neighborhoods continue to favor sellers even as the pace feels calmer than the boom years.
The independent home-value trackers point the same direction as the local MLS data. Zillow shows Portland values roughly flat over the past year, and Redfin reports Oregon sales volume up about 8% year over year with prices essentially flat. Flat prices and rising volume, from three separate sources, is a consistent signal.
- Inventory: eased from 4.3 to 3.1 months January through April, now flat year over year
- Pending Sales: up 5.9% year over year in April, up 5.6% year to date
- Median Price: up 7.8% since the January low, flat versus April 2025
- Market Time: down from 89 to 63 days since January, homes selling faster
Buyer Traffic Surged: The Showing Data Most Reports Never See
This is the number I find most encouraging, and it comes from data most reports never include. Lockbox showing activity reached about 83,995 in April, up roughly 21% from last year and the busiest April for buyer traffic since 2018. Buyers are out in force and getting serious about this spring.
Here is the honest nuance, and it is actually good news for buyers. Showings rose about 21% while closed sales rose 7.1%. Buyers are engaged and active, but they are taking their time, comparing options, and making careful decisions rather than rushing into bidding wars. That is a healthier, less frantic market than we saw a few years ago, and it gives serious buyers room to negotiate.
Want to See What Is Actually Out There?
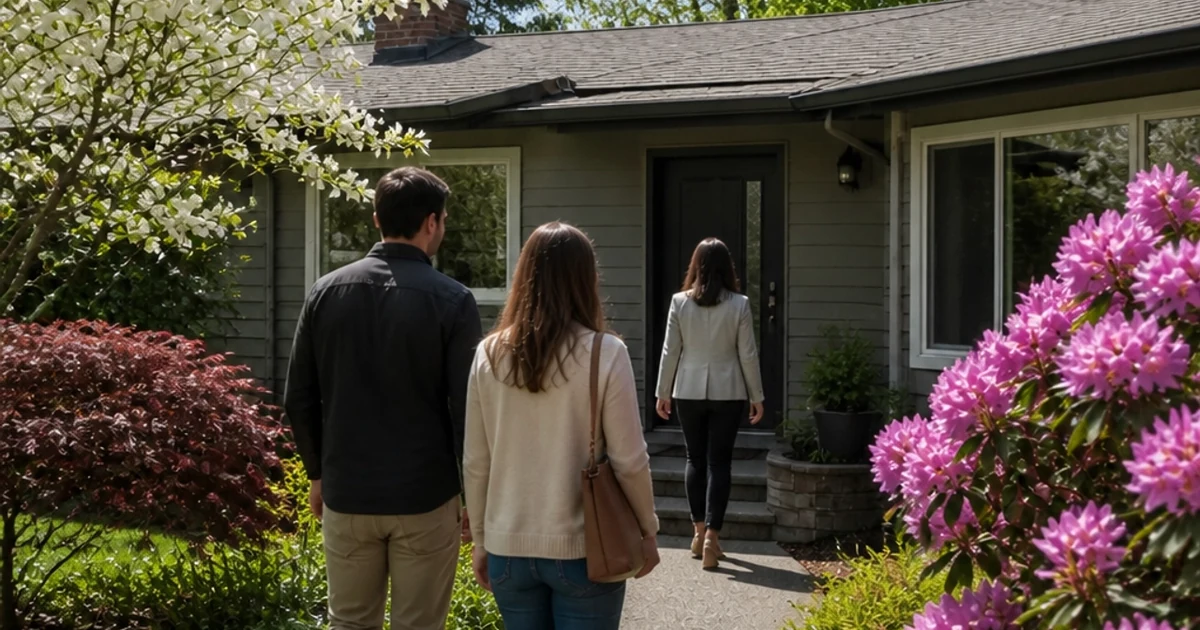
With more listings hitting the market this spring, now is a good time to explore your options. Browse current homes or reach out and I will help you make sense of what fits your goals. No pressure, no obligation.
Where We Are Now: Affordability Is Quietly Improving
Here is a positive that gets lost in the headlines. At April's $550,000 median with 20% down, financing $440,000 at the month's 6.33% average rate, the principal and interest payment is roughly $2,732 a month. A year ago, a nearly identical home at 6.80% ran about $2,895. That is close to $160 less per month for the same priced home, simply because rates came down. Taxes, insurance, and maintenance are on top of that.
Affordability is still stretched in absolute terms, no question. But the direction has turned in buyers' favor over the past year, and that improvement is the kind of thing that brings hesitant buyers back to the table.
What This Means for Buyers
If you are buying this spring, you are in a stronger position than buyers a few years ago. You have more homes to choose from, more time to decide, and a lower payment than last spring. Inventory near 3.1 months means no same-day, sight-unseen offers just to compete. You can tour, inspect, and negotiate. That said, well-priced, move-in-ready homes in popular neighborhoods still sell fast, so having financing in place matters.
Conditions favor prepared buyers who plan to stay put for several years. You are well positioned if you:
- Have a mortgage pre-approval in hand so you can move quickly on the right home
- Plan to own for at least five to seven years, which rides out short-term price wobbles
- Are comfortable with the payment at today's rate, and would view any future rate drop as a refinance bonus
- Want negotiating room, which the calmer pace and higher inventory now allow
What This Means for Sellers
Sellers have a real audience right now. With buyer traffic at its highest April level in years and homes selling in 63 days, the demand is there for homes priced right and shown well. The winning strategy is straightforward: price to where the market is, not last year's peak, invest in presentation so your home stands out among fresh spring inventory, and stay flexible on terms. Homes that check those boxes are still moving quickly.
To capture the strong buyer traffic this spring:
- Price to current comparable sales, not to last year's high-water mark
- Invest in presentation, since buyers comparing many homes reward the ones that show best
- Stay flexible on closing timing and small repair requests to keep good buyers moving forward
Sub-Market Spotlight: Where Demand Is Strongest
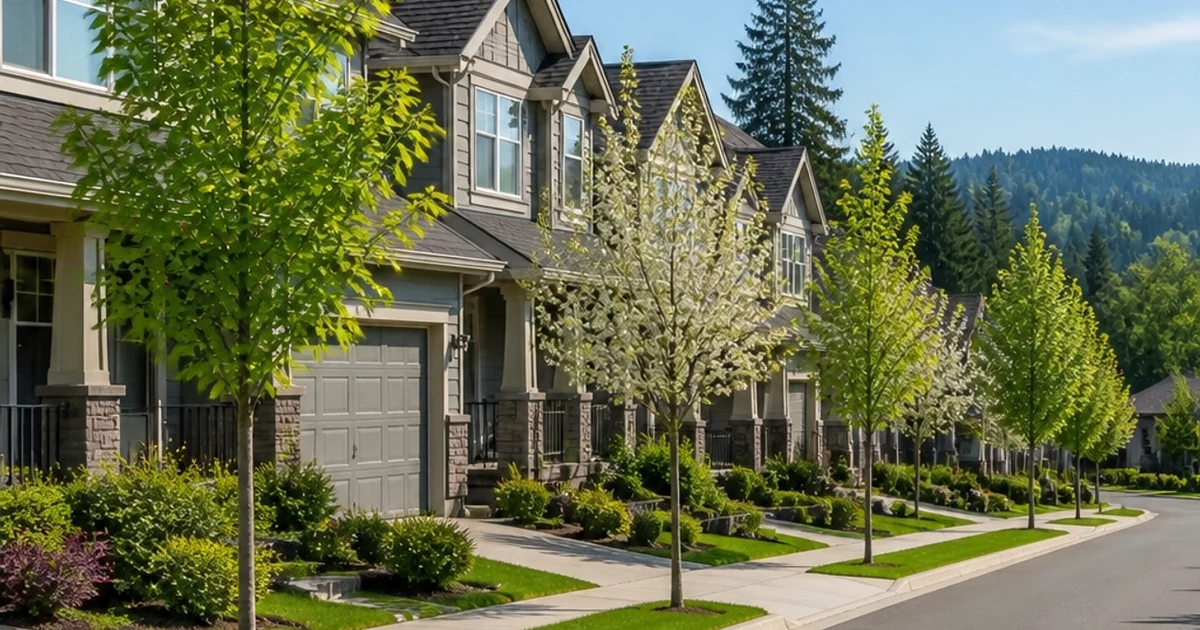
The metro is not one market, it is fifteen. This April the western suburbs stood out, with Beaverton and Aloha, Northwest Washington County, and Northeast Portland all posting double-digit gains in closed sales. Prices below are year-to-date medians, which smooth out monthly noise. The table starts with five of the most active areas; expand it to see all fifteen.
| Area | Median Price (YTD) | YoY Price | Closed Sales | YoY Sales |
|---|---|---|---|---|
| NE Portland | $513,000 | +4.6% | 191 | +22.4% |
| Beaverton / Aloha | $550,000 | +0.9% | 159 | +24.2% |
| NW Washington Co. | $676,800 | -5.4% | 104 | +25.3% |
| SE Portland | $455,000 | 0.0% | 253 | +3.3% |
| Lake Oswego / W Linn | $841,000 | -5.0% | 97 | +3.2% |
Inventory in Months: The Three-Year View
Inventory tells you how balanced the market is. At 3.1 months in April, supply is essentially flat with last year and still well below the six months that typically marks a balanced market. The current-year column is below. Expand to compare against the past two years.
| Month | 2026 |
|---|---|
| January | 4.3 |
| February | 3.6 |
| March | 3.0 |
| April | 3.1 |
When I see showings jump 21% but closings rise 7%, I do not read hesitation as weakness. I read it as buyers finally getting to shop like buyers again, with time to think, room to negotiate, and a payment that pencils better than it did last year.
Joe Saling
Curious What Your Home Is Worth Today?
With buyer traffic strong this spring, it is a good moment to understand your home's current value. Get a no-obligation valuation, or reach out if you are weighing whether to sell this year.
Where We're Going: What to Watch Next
No one can predict the market with certainty, but a few factors will shape the rest of 2026 for Portland Metro buyers and sellers. Here are the three that matter most right now.
Mortgage rates and Fed policy. The Federal Reserve held its benchmark rate steady at its April meeting and signaled patience, with markets expecting few or no cuts this year. The 30-year fixed eased to about 6.33% in April, and even modest further declines would keep pulling hesitant buyers off the sidelines, exactly the dynamic driving this spring's showing surge.
New Oregon housing laws. The state recently enacted a package of housing measures aimed at expanding supply and helping individual buyers. One gives families and small buyers a 90-day window to purchase a single-family home before large institutional investors can bid, and another makes it easier for cities to set aside land for housing geared to residents 55 and older. Over time, more supply and fewer large-investor purchases could help everyday buyers compete.
Construction and renovation costs. Building materials remain elevated, with framing lumber up sharply year over year and tariffs adding to the cost of items like cabinets and appliances. That keeps new-home and major-renovation budgets under pressure, which tends to push more demand toward existing homes and makes well-maintained resale properties more attractive.
Frequently Asked Questions
Is May 2026 a good time to buy a home in Portland?+
How much have Portland home prices changed?+
What does 3.1 months of inventory mean for the market?+
Which Portland Metro areas are selling fastest right now?+
How are Northeast Portland home prices doing?+
Did lower mortgage rates make buying more affordable?+
Will Portland home prices rise or fall through the rest of 2026?+
Let's Talk About Your Next Move
Whether you are buying, selling, or just trying to make sense of the numbers, I am happy to walk through what this market means for your situation. Education first, no pressure, no surprises.
Homes for Sale in Portland
Browse current listings across the Portland Metro area.
Portland Metro market statistics from RMLS Market Action Report, April 2026 reporting period, and the Portland Market Intelligence Tracker. Buyer showing activity from RMLS SentriLock lockbox data.
Mortgage rates from the Freddie Mac Primary Mortgage Market Survey. Federal Reserve policy from the April 2026 FOMC meeting minutes.
National price trends from the S&P Cotality Case-Shiller index, March 2026 and NAR Pending Home Sales.
Oregon housing legislation reported by the Oregon Capital Chronicle. Regional employment from CIO Dive. Construction cost context from the National Association of Home Builders.
Data verified: May 2026
Joe Saling
Real Estate Advisor | Saling Homes at eXp Realty
Joe Saling has been helping Portland-area buyers and sellers for 10 years, backed by 20+ years in sales, marketing, and leadership. He specializes in the Portland Metro market with a focus on data-driven decisions and client education. His approach: educate first, advocate always.
(503) 910-7364 | joe@sellingpdxhomes.com | sellingpdxhomes.com | About Joe
Saling Homes at eXp Realty is committed to equal housing opportunity. We do not discriminate on the basis of race, color, religion, sex, handicap, familial status, or national origin.
Categories
- All Blogs (93)
- Buying a Home (35)
- Community Page (14)
- Downsizing (7)
- Home Buying Process (7)
- Homeownership (6)
- Increasing Your Homes Value (4)
- Local Events (2)
- Market Update (21)
- Mortgage Information (9)
- Neighborhood Eats and Experiences (1)
- neighborhood info (3)
- Real Estate News (15)
- Selling Your Home (20)
Recent Posts










GET MORE INFORMATION