Portland Metro March 2026: median price $543,800, buyer showings up 44%, inventory at 3.0 months. Data-driven market analysis for buyers and sellers.
by Joe Saling
Portland's Tilikum Crossing in early spring. The metro area's housing market opened the 2026 spring season with the strongest buyer activity in years.
Spring 2026 arrived in Portland Metro with real momentum. Buyer showing activity hit the highest March level since 2018, closed sales jumped 11% year over year, and affordability reached its best point since early 2022. With 5,311 active listings giving buyers the most options in any March since 2019, the spring market is delivering what buyers and sellers have been waiting for.
$543,800Median Sale Price+0.3% YoY
3.0 moInventoryFlat YoY
1,790Closed Sales+11.0% YoY
79 daysTotal Market Time+8 days YoY
6.37%Mortgage Rate-53 bps YoY
Quick Answer
In March 2026, Portland Metro closed sales rose 11% year over year to 1,790 while the median sale price held steady at $543,800. Buyer showing activity surged 44% to the highest March level since 2018. Inventory sits at 3.0 months with 5,311 active listings, creating the most balanced conditions since early 2022. Mortgage rates averaged 6.37%, down 53 basis points from a year ago.
Market Overview: Buyers and Sellers Both Have Reasons to Move
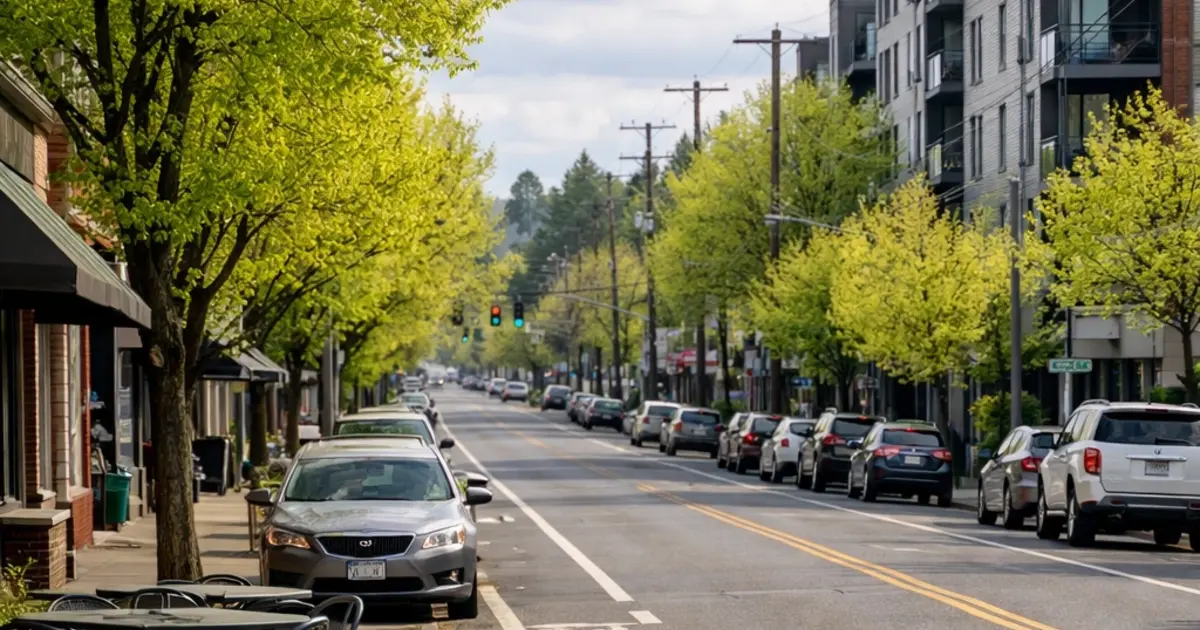
SE Portland's Division Street corridor. Across the metro, active listings hit 5,311 in March, the most spring inventory since 2019.
The March numbers tell a positive story: more people are buying, more homes are available, and prices are holding steady. Closed sales hit 1,790 (+11% YoY), pending sales reached 2,319 (+5.5% YoY, the first clear positive reading of 2026), and inventory tightened from 3.5 months in February to 3.0 in March as buyer demand outpaced new supply. That's balanced territory where a healthy market operates.
+Continue reading: Full market analysisPending sales accelerated for three consecutive months, and the $400K-$600K sweet spot accounted for 40% of closings.
On the supply side, active listings reached 5,311, up 9.1% from a year ago. New listings grew 2.7%. The fact that inventory tightened despite more homes being available tells you something important: buyers aren't just looking, they're acting.
The price picture is stable. The median at $543,800 is essentially flat year over year (+0.3% from $542,000). Prices peaked around $570,000 in June 2025 and have settled into a $510K-$544K range for four consecutive months. This isn't a market that's declining. It's a market that found its level and is holding there while transactions ramp up.
The gap between average sale price ($614,200) and median ($543,800) is $70,400, about 13%. That's a normal spread, meaning the luxury segment isn't disproportionately skewing the data. The price range breakdown shows the core of the market: $300K-$700K accounted for 66.6% of all closings, with the $400K-$600K sweet spot responsible for 40.6% of transactions. The $700K-$900K move-up segment grew 25% year over year, signaling that existing homeowners are gaining the confidence to make their next move.
The pending sales trajectory is worth highlighting. January came in at -0.6% YoY, February improved to +1.0%, and March jumped to +5.5%. Three consecutive months of acceleration. That's not a blip. That's a trend forming.
Nationally, the picture aligns. NAR reported February existing home sales rose 1.7% with a median of $398,000 and affordability improved for the eighth consecutive month. Portland's median runs 37% above national, but Portland's transaction growth (+11% YoY) is outpacing the national trend, which was still negative year over year in February. The local market is performing better than the national average on volume.
Data Point: 6-Month Trend Summary
Inventory: Rose from 2.9 months (Dec) to 4.3 (Jan), then tightened to 3.0 (Mar) as buyer demand absorbed supply
Pending Sales YoY: Improved from -8.4% (Jan) to -1.6% (Feb) to +5.5% (Mar), now firmly positive
Median Price: Stabilized in the $510K-$544K range for four months after declining from $570K (Jun 2025)
Market Time: Peaked at 91 days (Feb), dropped to 79 (Mar), still above 71 days a year ago
Buyer Activity: 77,365 Showings Tell the Real Demand Story
SentriLock lockbox data is the closest thing to a real-time demand signal in our market, and no competitor report includes it. In March, Portland Metro recorded 77,365 lockbox openings, up 43.9% from March 2025 and the highest March total since 2018. Buyers are walking through homes at a pace this market hasn't seen in years, and that's a positive signal for everyone.
+See the full showing data breakdownWeekly showings averaged 19,231 in March 2026 vs. 12,530 last year, a 53% jump approaching pre-pandemic levels.
That level of foot traffic means something for both sides of a transaction. For sellers, the audience is there. For buyers, it confirms that others see the same value in this market, so preparation and decisiveness still matter even though conditions are more relaxed than the bidding-war years.
The weekly data shows strong momentum with a late-month pause. The first three weeks of March saw escalating activity: 18,790 (week ending 3/1), 19,906 (3/8), and 20,171 (3/15), the peak week of the year so far. Activity pulled back in the final two weeks: 19,380 (3/22) and 17,908 (3/29), correlating with rising mortgage rates tied to the Middle East conflict.
For context, the March weekly average was 19,231 in 2026 compared to 12,530 in 2025 and 13,323 in 2024. That's a 53% jump over last year's weekly pace. Looking at the longer history, March 2026 (77,365) is approaching the pre-pandemic range of 2016-2018, when March totals ran between 77,000 and 87,000. We're nearly back to the showing levels that supported a healthy, active market before the pandemic distorted everything.
The forward signal is encouraging. The first week of April (week ending 4/5) recorded 19,050 showings despite higher rates. Buyers have not left the field. The relationship between showings and closed sales is healthy: showings up 44% while closings rose 11%. That gap reflects buyers having the luxury of being selective with 5,311 listings to choose from, not a market where people are looking but afraid to act.
With 5,311 active listings and buyer activity at its highest level since 2018, spring 2026 is offering real options. Take a look at what's on the market or reach out to talk strategy.
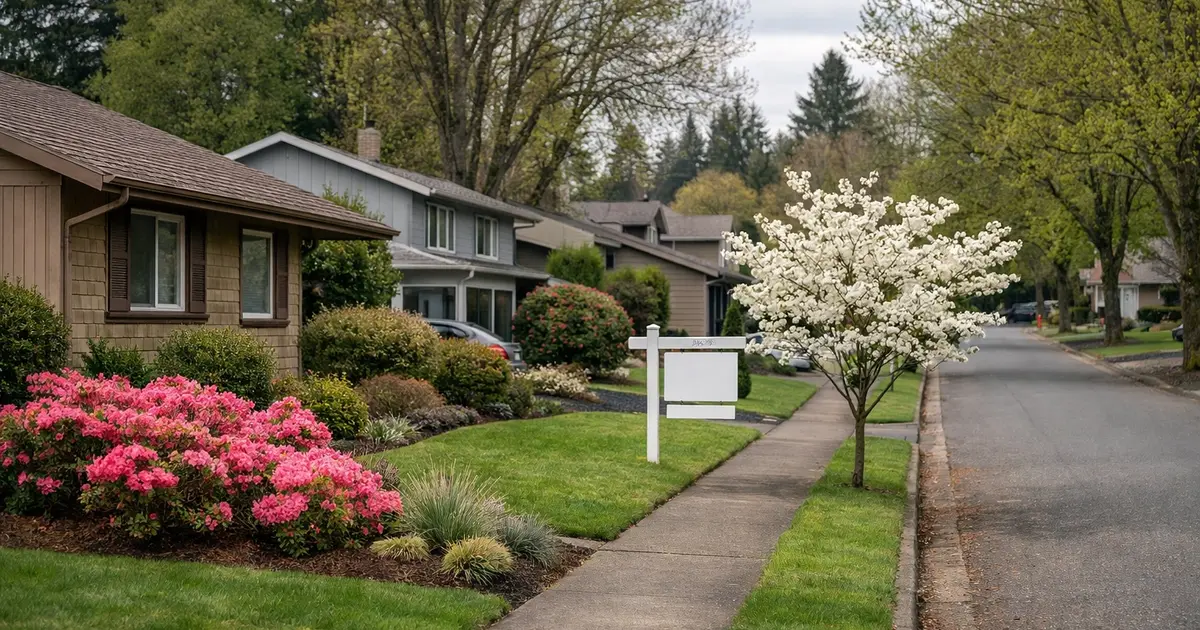
A Beaverton neighborhood in early spring. Washington County submarkets are showing strengthening demand signals as buyers seek value in the west-side corridor.
Affordability: Lower Rates, Stable Prices, Better Math
The affordability picture heading into April is the best it's been since early 2022. On the March median-priced home of $543,800 with 20% down at 6.37% (Freddie Mac PMMS), the monthly P&I payment is approximately $2,718. That's $140 less per month than March 2025 when rates were 6.90%, and the RMLS Affordability Index reached 0.98, approaching balanced territory for the first time in years.
+Read more: How affordability is trendingBuyers who locked rates in early March saved roughly $1,300 per year compared to those who waited until month's end.
Data Point: March 2026 Mortgage Math
Median home: $543,800. Down payment (20%): $108,760. Loan: $435,040 at 6.37%. Monthly P&I: $2,718. Same calculation in March 2025 at 6.90%: $2,858. You save $140/month ($1,680/year) compared to last spring. Taxes, insurance, and maintenance are additional.
The improvement comes from rates dropping roughly 53 basis points year over year while prices held flat, combined with HUD Median Family Income for the Portland MSA at $124,100.
Mortgage rates moved significantly within March. Per Freddie Mac: 6.00% on March 5 (the lowest since 2022), 6.22% by March 19, and 6.38% by March 26. The climb was driven by the Middle East conflict pushing oil prices and inflation expectations higher. Buyers who locked rates in the first half of March got a materially better deal. At 6.00%, the same $543,800 home costs $2,611/month P&I. At 6.38%, it's $2,719. That $108/month difference adds up to roughly $1,300 per year.
The positive takeaway: even at the higher end of March's rate range, the monthly payment is still $140 less than March 2025. Nationally, NAR's Housing Affordability Index hit 117.6 in February, the highest since March 2022, with wage growth outpacing home price growth by nearly four percentage points. Affordability is on the right trajectory even with short-term rate volatility.
If you've been waiting for better conditions, this is what "better" looks like. April 2026 offers more homes to choose from than any spring since 2019, rates that are still lower than any point in the last three years, and a market where you can keep your contingencies and negotiate without competing against ten other offers.
+Read more: Buyer strategy and when to be cautiousRate lock timing, negotiation leverage on 60+ day listings, and when caution makes more sense than action.
Win Strategy: Buyer Conditions This Spring
Get pre-approved now so you can move quickly if rates dip. Rate lock timing matters more than usual right now.
Homes sitting 60+ days are where your negotiating power is strongest. The Portland Metro market data dashboard shows which areas have the longest market times.
Keep your inspection and financing contingencies. This is not a market where you need to waive protections to win.
If this is your first purchase, walk through the Portland home buying process so you know what to expect at each step.
Important: When to Be Cautious
If you plan to sell within 2-3 years, the current flat appreciation may not build enough equity to cover transaction costs. If your debt-to-income ratio is already stretched, rising energy costs and potential further rate increases could make the payment uncomfortable. And if you're buying primarily as a short-term investment rather than a home, this is not the market for speculative appreciation. Buy because it's the right home, not because you're betting on quick gains.
The buyer pool heading into April is the deepest it's been in years. March delivered 77,365 showings and 2,319 pending sales, which means motivated buyers are actively touring and writing offers across the metro. If your home is priced right and shows well, the audience is there. The key is capturing that attention in a market where buyers have options.
+Read more: Seller strategy and when waiting makes sensePricing to recent comps, pre-listing inspections, and when waiting for better timing could be the smarter play.
Win Strategy: Pricing and Presentation This Spring
Price to the comparable sales from the last 60 days, not from last summer's higher values. Invest in professional photography, decluttering, and minor repairs before listing. Consider a pre-listing inspection to eliminate surprises. Flexibility on terms (closing timeline, repair credits) can be the difference when a buyer has other options. If you want to understand what your Portland home is worth today, start there.
Important: When Waiting May Make Sense
If you're in a sub-market with softening signals (like Columbia County or N Portland), listing in mid-spring (late April through May) rather than early April may give you a stronger buyer pool. If your home needs significant repairs, the cost of materials is elevated due to tariffs on lumber, steel, and copper, so factor those costs into your pricing strategy. If your next purchase depends on lower rates, waiting for rate clarity could make the overall move financially smoother.
The Portland Metro area spans 15 distinct market zones across Multnomah, Washington, Clackamas, Columbia, and Yamhill counties.
Sub-Market Spotlight: 15 Zones, 15 Different Stories
The metro-wide numbers mask significant variation across 15 zones. The table below covers the 5 most notable areas from March, with the full breakdown behind the expand.
Area
Median Price
12mo Price Chg
Closed Sales
Closed YoY
DOM
Signal
Tigard/Wilsonville (151)
$610,000
-1.1%
155
-1.9%
77
STABLE
Beaverton/Aloha (150)
$541,000
-0.2%
151
+9.4%
68
STRENGTHENING
NW Wash. Co. (149)
$650,000
-5.7%
77
+6.9%
86
STRENGTHENING
Lake Oswego/WL (147)
$820,000
-1.1%
99
+37.5%
85
STABLE
NE Portland (142)
$510,500
+1.4%
185
+35.0%
44
HOT
Swipe to see more columns
+View all 15 Portland Metro sub-marketsFrom NE Portland's HOT signal at 44 days to Columbia County's softening trend, every zone tells a different story.
Area
Median
12mo Chg
Closed
YoY
DOM
Signal
N Portland (141)
$459,000
+4.0%
75
-22.7%
99
STABLE
NE Portland (142)
$510,500
+1.4%
185
+35.0%
44
HOT
SE Portland (143)
$443,000
+1.1%
199
-3.4%
65
HOT
Gresham/Troutdale (144)
$479,900
-1.7%
113
+15.3%
80
STABLE
Milwaukie/Clackamas (145)
$542,000
-1.8%
183
+33.6%
86
STRENGTHENING
Oregon City/Canby (146)
$581,000
-1.1%
90
+18.4%
90
STRENGTHENING
Lake Oswego/West Linn (147)
$820,000
-1.1%
99
+37.5%
85
STABLE
W Portland (148)
$653,500
+0.7%
179
+32.6%
99
STABLE
NW Washington Co. (149)
$650,000
-5.7%
77
+6.9%
86
STRENGTHENING
Beaverton/Aloha (150)
$541,000
-0.2%
151
+9.4%
68
STRENGTHENING
Tigard/Wilsonville (151)
$610,000
-1.1%
155
-1.9%
77
STABLE
Hillsboro/Forest Grove (152)
$500,000
-2.5%
153
+28.6%
80
STABLE
Mt. Hood (153)
$535,000
-5.3%
10
-9.1%
215
STRENGTHENING
Columbia Co. (155)
$455,000
+3.6%
38
-13.6%
95
SOFTENING
Yamhill Co. (156)
$470,700
+1.2%
83
-26.5%
88
STABLE
Swipe to see more columns
Source: RMLS Market Action Report, March 2026. All 15 Portland Metro sub-market zones (Areas 141-156).
Inventory in Months: 2026 vs. Prior Years
Month
2026
2025
2024
January
4.3
3.7
3.7
February
3.5
3.2
3.3
March
3.0
3.0
2.6
+View the 3-year inventory comparison (full year)2025 peaked at 3.8 months in September and November. See where 2026 is tracking against the full cycle.
1. Affordability momentum is real. The RMLS Affordability Index at 0.98 is the closest to balanced since early 2022. NAR's national index hit its highest point since March 2022. If rates stabilize near current levels, this improved affordability could sustain buyer demand well into summer.
2. Spring inventory is building. New listings grew 2.7% year over year in March. April and May are traditionally the peak listing months. More supply keeps prices stable and gives buyers even more choices.
3. Mortgage rates are the key variable. Rates opened March near 6.00% and closed at 6.38%, then climbed above 6.50% in early April. HousingWire's analysts identify 6.25% as a key demand threshold: below it, the market gains traction; above it, buyer activity starts to fade.
+See all factors to watchEnergy costs, tariffs adding $10,900 per new home, the Fed Chair transition, and what April's data will reveal.
4. Energy costs and the Middle East conflict. The conflict that began in late February sent oil prices higher and pushed mortgage rates up nearly 40 basis points during March. The Fed held rates at 3.50%-3.75% at its March meeting and signaled possibly one cut this year. How quickly the conflict resolves will determine whether rates settle back toward 6% or stay elevated.
5. Oregon's employment landscape. The tech sector continues to restructure, but buyer demand across Washington County sub-markets remains strong. Beaverton/Aloha, NW Washington County, and Milwaukie/Clackamas are all showing STRENGTHENING signals, suggesting the broader economy is absorbing shifts in the employment mix.
6. Tariffs and construction costs. Steel, aluminum, and copper carry 50% tariffs. Lumber at 10% plus anti-dumping duties. NAHB estimates roughly $10,900 added per new home. This constrains new construction supply and supports existing home values, but makes renovation more expensive for buyers evaluating fixer properties.
7. Fed Chair transition. Powell's term ends in May, with Warsh expected to take over. The leadership change adds a variable to rate expectations, though the underlying mechanics are unlikely to shift quickly.
8. What April data will reveal. April is the first full month with elevated rates present throughout. If pending sales hold above 2,000 and showings stay above 17,000 per week, the spring market has real legs. That data will tell us whether March's momentum is a launchpad or a peak.
Spring 2026 offers the most balanced conditions since early 2022. Inventory is up 9% year over year, mortgage rates are lower than any point in the last three years, and prices are stable. Buyers have more choices, more time to decide, and better negotiating leverage than at any point in recent memory. The one variable to watch: rate volatility from the Middle East conflict means locking sooner rather than later may matter.
How much have Portland home prices changed?+
The median sale price in March 2026 was $543,800, up just 0.3% from $542,000 in March 2025. Prices peaked around $570,000 in June 2025 and have since settled into a $510K-$544K range. This is a market with stable, not declining, values. The two-year change from March 2024 ($529,900) is +2.6%.
What is 3.0 months of inventory and what does it mean?+
Months of inventory measures how long it would take to sell every active listing at the current sales pace. At 3.0 months, Portland sits in balanced territory. Below 3 months tends to favor sellers; above 4-5 months tends to favor buyers. At 3.0, neither side has a strong advantage, which creates the healthiest conditions for both parties to negotiate fair deals.
Which Portland neighborhoods are the hottest right now?+
NE Portland (Area 142) leads the metro with a HOT market signal, 44-day average market time, and a 35% year-over-year increase in closed sales. SE Portland (143) also carries a HOT signal. On the west side, Beaverton/Aloha (150) and NW Washington County (149) are showing STRENGTHENING signals with rising transaction volumes and shorter market times.
What mortgage rate should I expect this spring?+
Rates started March near 6.00% and ended near 6.38%, driven higher by the Middle East conflict. As of early April, rates are in the mid-6% range. Industry analysts see rates ranging between 5.75% and 6.75% for 2026, with the lower end possible if the conflict resolves and inflation pressures ease. Getting pre-approved and locking at the right moment matters more now than in a stable rate environment.
Will Portland home prices drop in 2026?+
The data does not support a price crash scenario. Prices have been stable in the $510K-$544K range for four months, buyer demand is strong (showings up 44% YoY), and Oregon's land use laws limit new supply. A modest softening of 1-3% in some sub-markets is possible if rates climb significantly, but a broad decline would require a major economic shock beyond what current conditions suggest.
Is the Portland market a buyer's market or a seller's market?+
At 3.0 months of inventory, Portland is in balanced territory. Buyers have more leverage than at any point since 2022, with more homes available, more time to evaluate, and the ability to keep contingencies. Sellers benefit from the strongest buyer foot traffic in years. Both sides can make good deals right now if they approach the market with realistic expectations.
Whether you are thinking about selling, planning a purchase, or just want to understand what your home is worth today, I am here to help. No pressure, no obligation.
Historical market data: Saling Homes Portland Metro Market Intelligence Tracker, 1992-2026.
Data verified: April 2026
Joe Saling
Real Estate Advisor | Saling Homes at eXp Realty
Joe Saling is a Real Estate Advisor at Saling Homes at eXp Realty, serving buyers and sellers across the Portland Metro area. With 10 years in Portland real estate and 20+ years in sales, marketing, and leadership, Joe specializes in helping clients understand the market and make confident, well-informed decisions. His approach is education first, no pressure, no surprises.
Saling Homes at eXp Realty is committed to equal housing opportunity. We do not discriminate on the basis of race, color, religion, sex, handicap, familial status, or national origin.